Splunk, Inc., produces software for searching, monitoring, and analyzing machine-generated big data using a web-style interface. Splunk captures, indexes, and correlates real-time data in a searchable repository from which it generates graphs, reports, alerts, dashboards, and visualizations.
If you are already using Splunk for SIEM and analytics requirements can send logs generated by Versa Analytics nodes, such as alarm logs, event logs, threat logs also, to the Splunk software so that you have a single monitoring system across all you network products.
The Analytics log collector receives logs from branches, hubs, and Controllers in IPFIX format. You can configure the Analytics node to send the logs to Splunk, using either UDP or TCP, in the syslog key-value pair format. You can configure Splunk to receive the logs and to display them using its Web interface.
Configure Analytics Node to Stream Logs to Splunk
You configure the Analytics log collector to send logs to the IP address and port in the Splunk application that is configured to receive logs.
For demonstration purposes, you can configure the Splunk application on the same node as the Analytics log collector. However, t is recommended that you do not run the software directly on the Analytics node in a production setup.
The following examples commands show how to configure Versa Analytics to stream its logs from the Analytics log collector to Splunk Interface:
# VAN IP Address [Local IP Address in VAN node]
% set log-collector-exporter local collectors col address 192.168.77.4
% set log-collector-exporter local collectors col port 1234
% set log-collector-exporter local collectors col transport tcp
% set log-collector-exporter local collectors col storage directory /var/tmp/log/
% set log-collector-exporter local collectors col storage format syslog
% set log-collector-exporter remote templates syslog-template type syslog

# Splunk IP Address [IP address of the node where the Splunk is installed. In this example, Splunk is installed on VAN node, therefore, the IP is same as VAN].
% set log-collector-exporter remote collectors splunk destination-address 192.168.77.4
% set log-collector-exporter remote collectors splunk destination-port 514

# VAN IP Address [Local IP Address in VAN node]
% set log-collector-exporter remote collectors splunk source-address 192.168.77.4
% set log-collector-exporter remote collectors splunk transport udp
% set log-collector-exporter remote collectors splunk template syslog-template
% set log-collector-exporter remote collector-groups splunk-cg collectors [ splunk ]
% set log-collector-exporter remote profiles splunk-profile collector-group splunk-cg
% set log-collector-exporter exporter rules rule1 match local-collector col
% set log-collector-exporter exporter rules rule1 match log-types [ alarm-log flow-log firewall-log threat-log ]
% set log-collector-exporter exporter rules rule1 set remote-collector-profile splunk-profile
Set Up the Splunk Application
If the Splunk software is not installed in your network, install. You can install a free trial version.
- Download the free trial version of the enterprise software from https://www.splunk.com/en_us/download/splunk-enterprise.html.
- Install the software either in a separate VM or in an existing VM node. It is recommended that you do not run the software directly on the Analytics node in a production setup.
- Start Splunk:
dpkg -i splunk-<6.6.1-aeae3fe0c5af-linux-2.6-amd64>.deb (Version may vary over time)
sudo /opt/splunk/bin/splunk start
To integrate the Splunk application with Versa Analytics, you install the Splunk Application for Versa Networks. This application is a reporting and analysis tool for Versa services that automatically processes Versa logs and provides a web interface for displaying information about Versa services. You can install Splunk Application for Versa Networks on Splunk Releases 6.1 and later. To install the Splunk Application for Versa Networks:
- Download the splunk_versa.tar file from https://versanetworks.box.com/s/5uiskasok7pfuxzv4t9frpizrv3fgbwf or alternatively from: https://upload.versa-networks.com/index.php/s/vrRgq3DFR8qSiaW
- In the Splunk Window, select the Apps >Manage Apps tab.
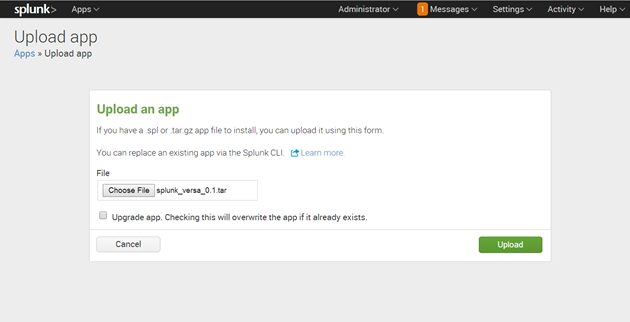
- In the File field, select the file path to the Versa Application.
- If you are upgrade the Versa Application, click Upgrade App.
- Click Upload.
- Restart Splunk.
- In the Splunk software, select the Settings > Data Inputs tab.
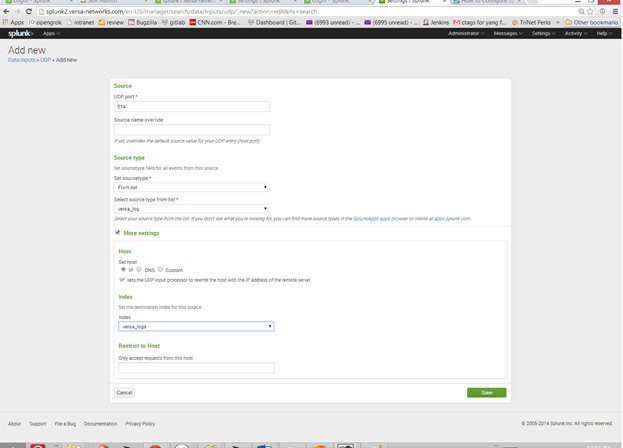
- In the Data Input field, select the protocol to use, either UDP or TCP.
- In the Port field, enter the number of the port on which to send the logs.
- In the Source field, select versa_log.
- In the Index field, select versa_logs.
- Click Save
In the Splunk Apps tab, click the Splunk for Versa Networks tab to view the web screens that display information about Versa services.