The software-as-a-service (SaaS) application monitoring is used to perform SD-WAN performance-based path selection. SaaS application monitoring checks each next hop for liveness and monitors application performance.
The Versa Operating System traffic-steering software allows you to select the best forwarding path using the following methods:
Passive application steering—Uses passively collected, single-ended application performance metrics. Single-ended deployments are ones that do not require another participating VOS device. Passive application steering is also known as inline application monitoring.
Active application steering—Uses active performance monitoring data.
Step 1:- Create a Saas App Monitor:-
You can use any one type of Monitor (icmp,Http,tcp)
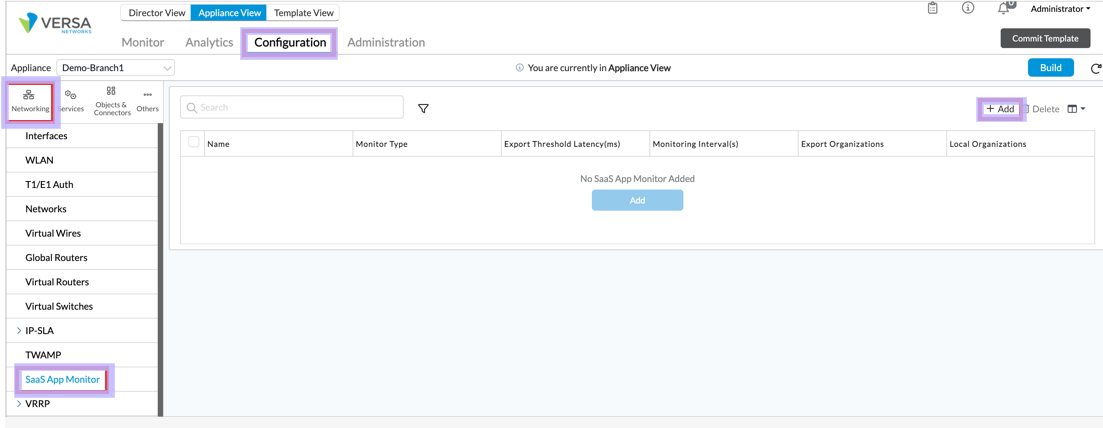
Type 1:- ICMP
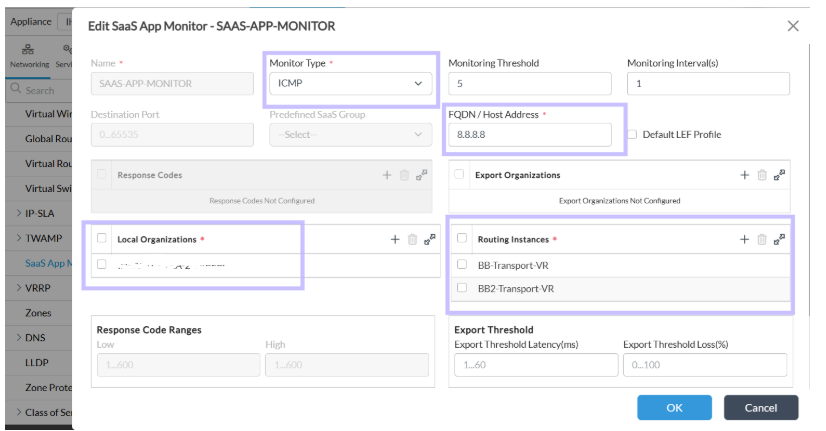
Type 2 :HTTP :-
Incase if you want to Monitor with fqdn then you have select Monitor type as HTTP, configure FQDN and add the Low and high code response.
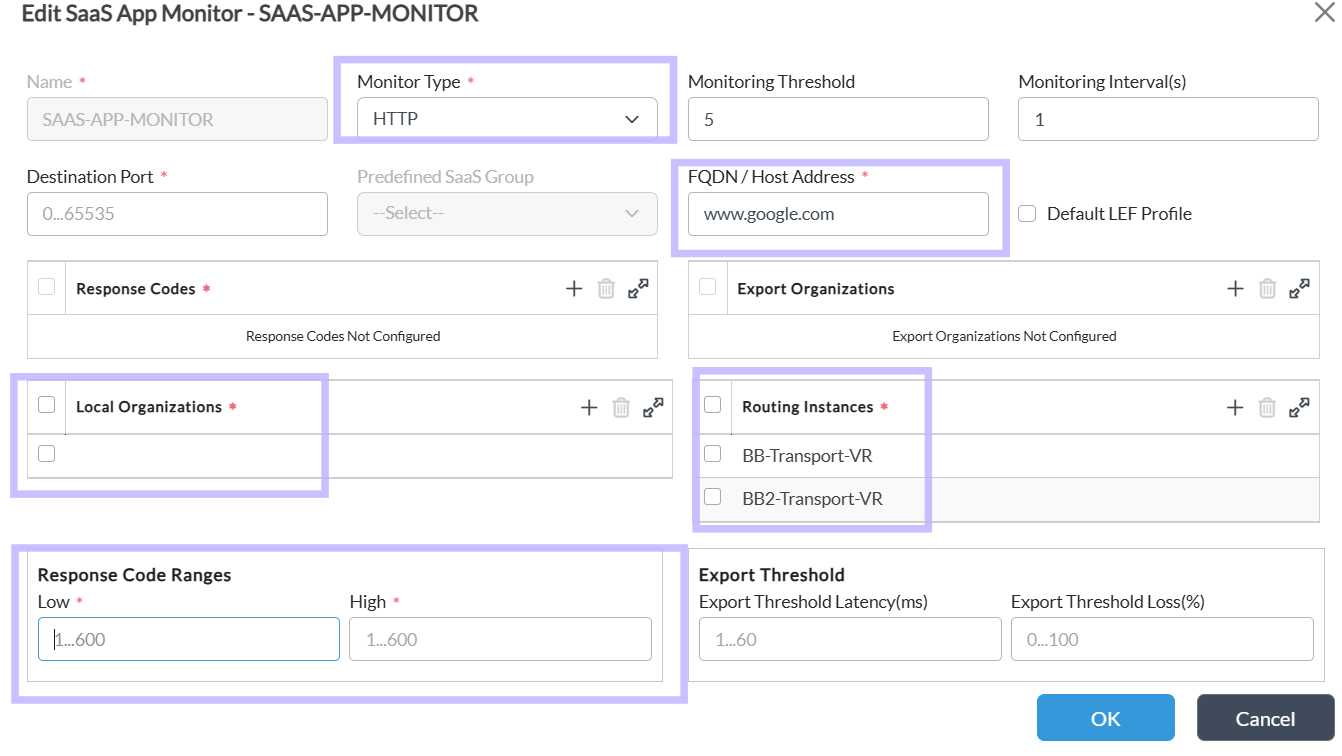
- Success Range (2xx):
- Low: 200
- High: 299
- Example: This range captures all successful responses.
- Client Error Range (4xx):
- Low: 400
- High: 499
- Example: This range captures all client error responses.
- Server Error Range (5xx):
- Low: 500
- High: 599
- Example: This range captures all server error responses.
- All 2xx, 3xx, 4xx, and 5xx:
- If you want to capture all successful (2xx), redirection (3xx), client errors (4xx), and server errors (5xx), you can set:
- Low: 200
- High: 599
- If you want to capture all successful (2xx), redirection (3xx), client errors (4xx), and server errors (5xx), you can set:
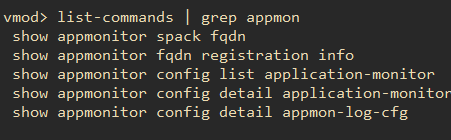
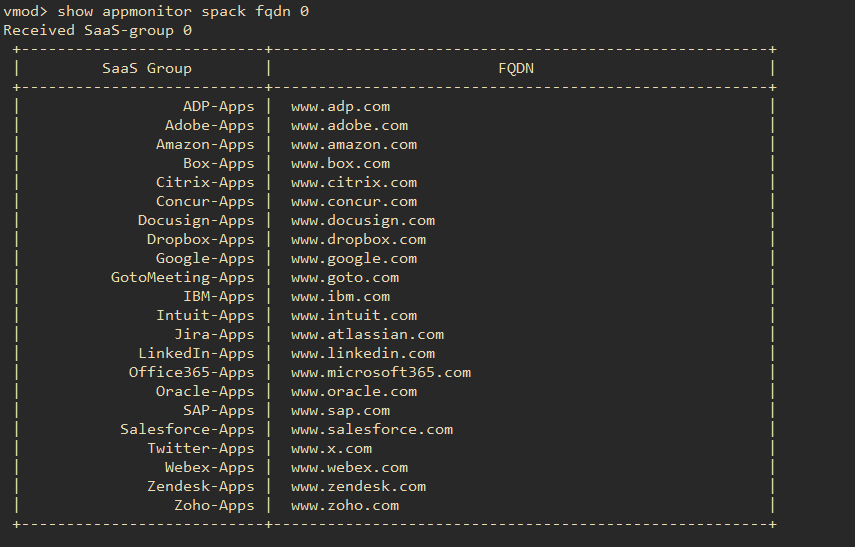
Note:- In older releases we won't support fdqn (Monitor type HTTP) in saas application monitor, Please check from the vmod if the VOS version supports fqdn or not.
vsh connect vmod
show appmonitor spack fqdn 0 -> if your unable to run this command then the VOS your checking doesn't supports fqdn
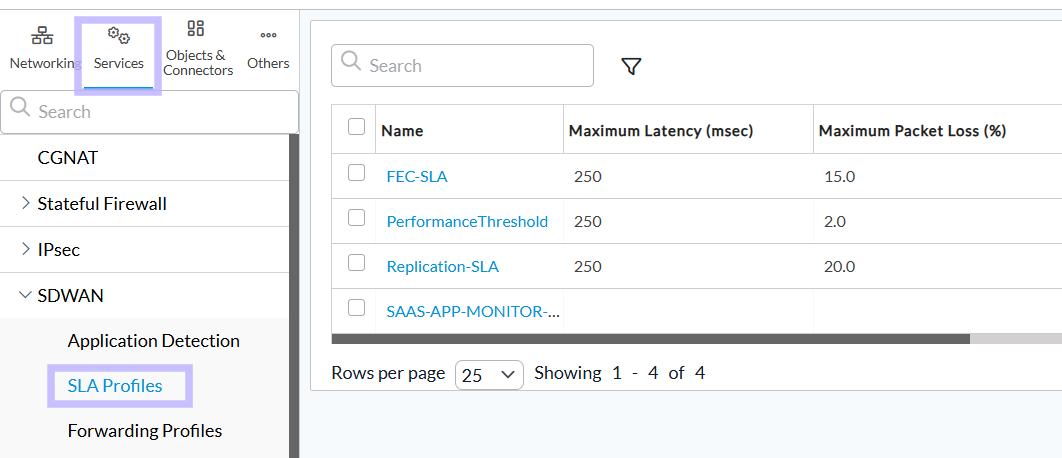
Step 2:- Create a SLA profile :-
Select Services -> SDWAN-> SLA Profiles ->Add
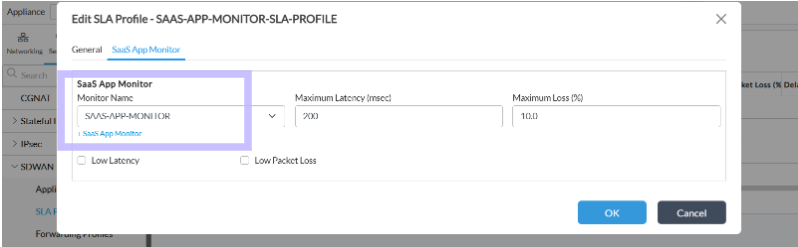
Go to Saas App Monitor tab then add the SaaS App Monitor which is created in step1 and give the Max Latency and Loss percentage.
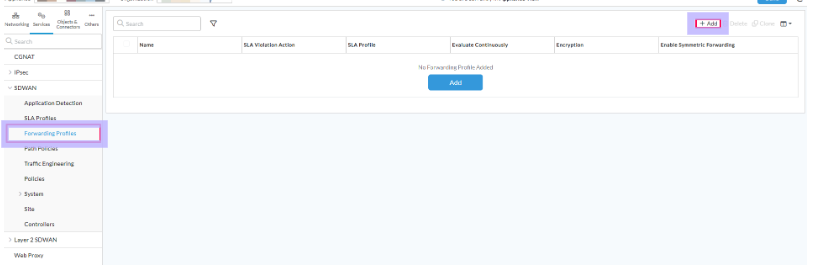
Step 3 :- Create a Forwarding Profile :-
Select Services > SD-WAN > Forwarding Profiles > Click the add icon and create a Forward Profile
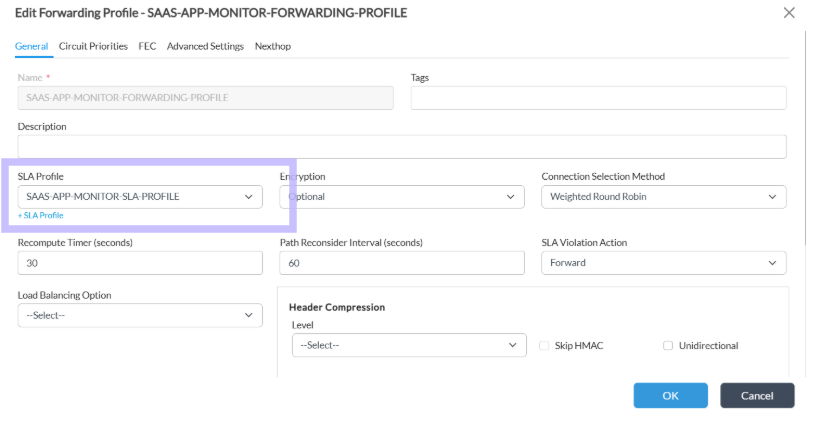
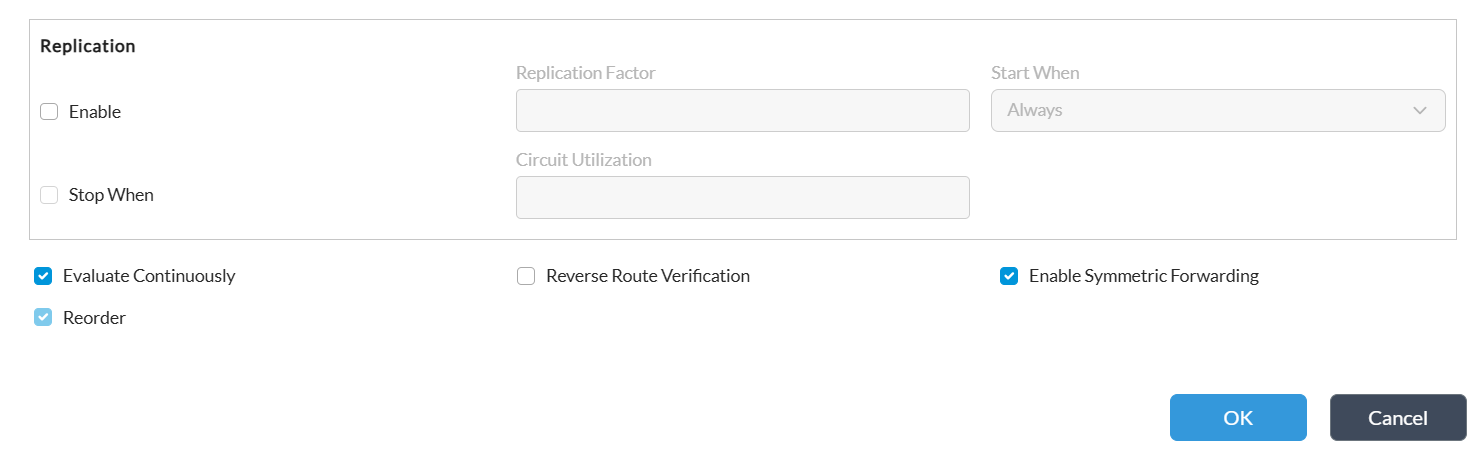
In General add SLA profile which was created in Step 2 and add other parameters.
Select the Next Hop tab and in the Next-Hop Selection Method field, select Load Balance
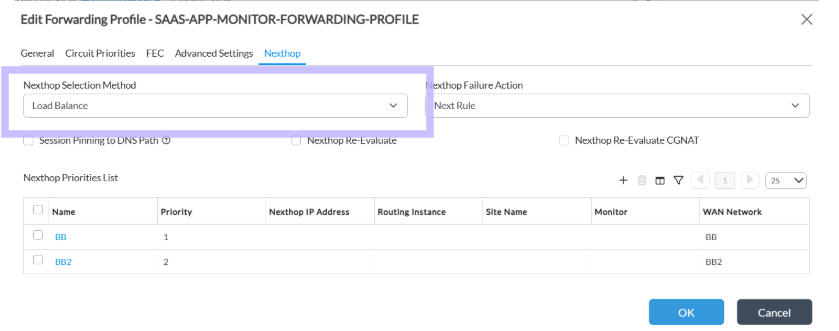
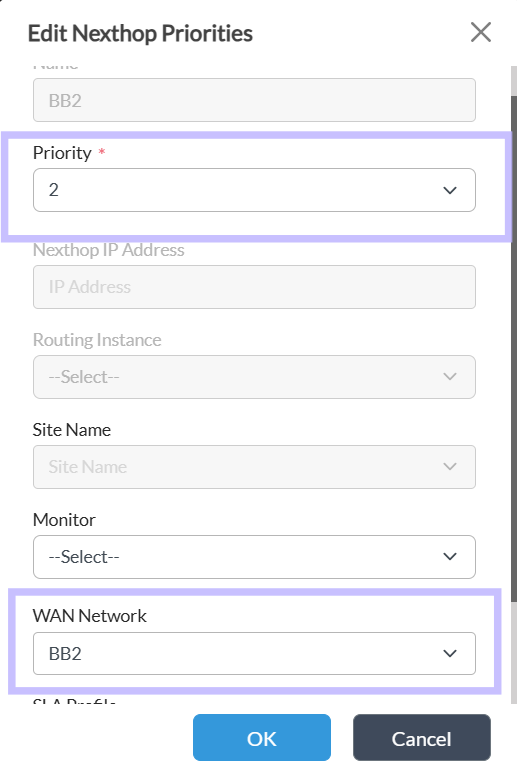
In the Next Hop Priorities List table, configure at least two next hops that have different priority. Click the + Add icon to display the Add Next Hop Priorities popup window.
Just configure Priority and Wan Network
Priority 1:-
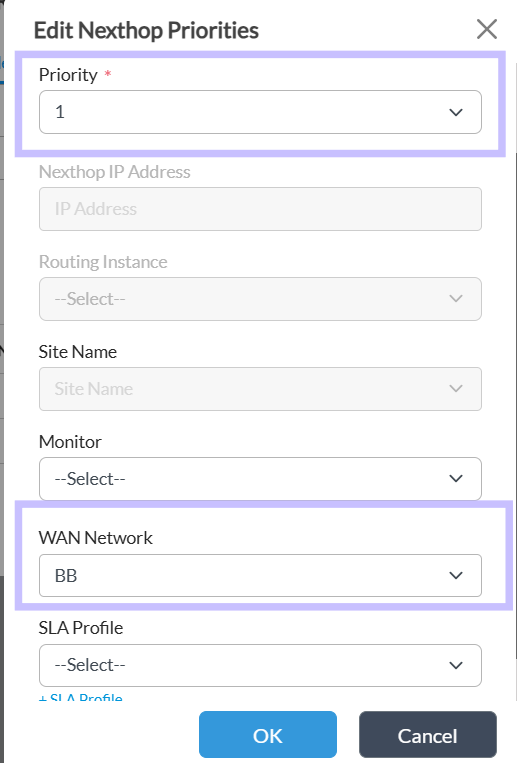
Priority 2:-
Step 4 :- Create a SDWAN rule:-
Select Services -> SDWAN-> Policies
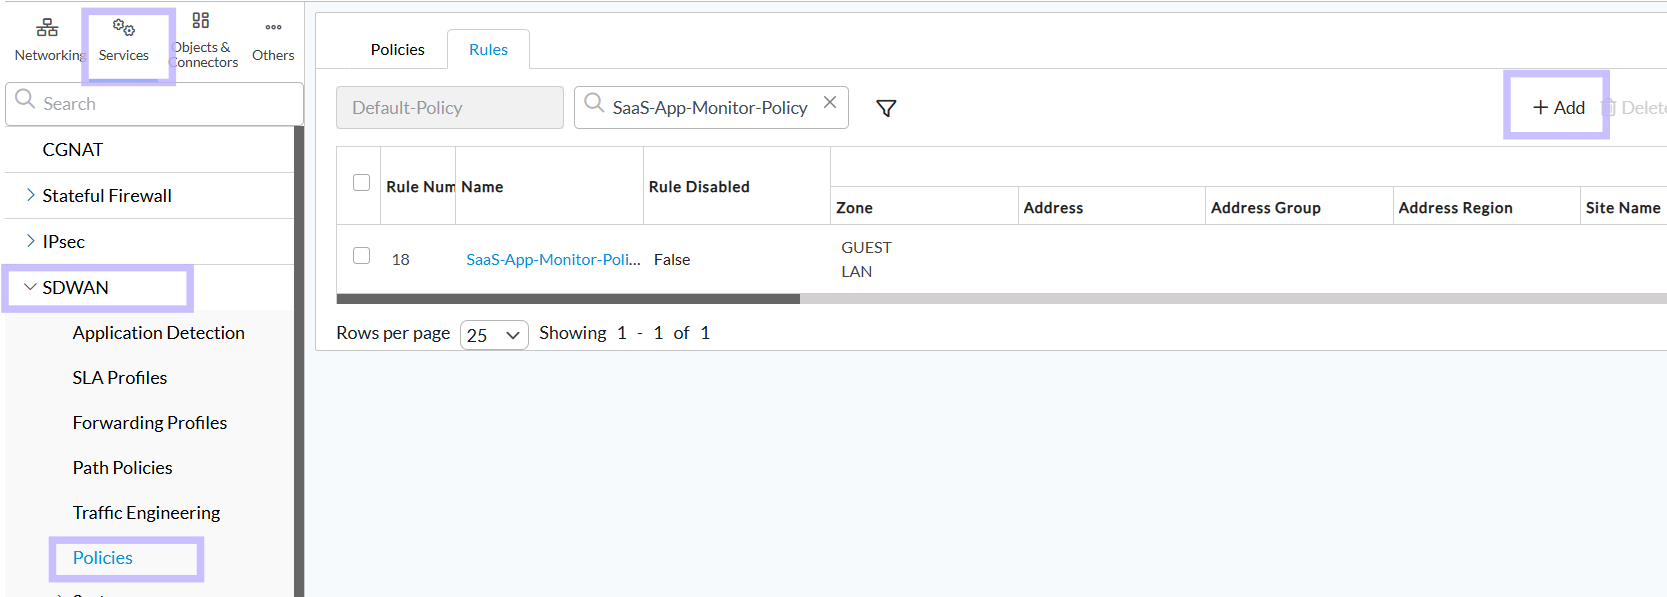
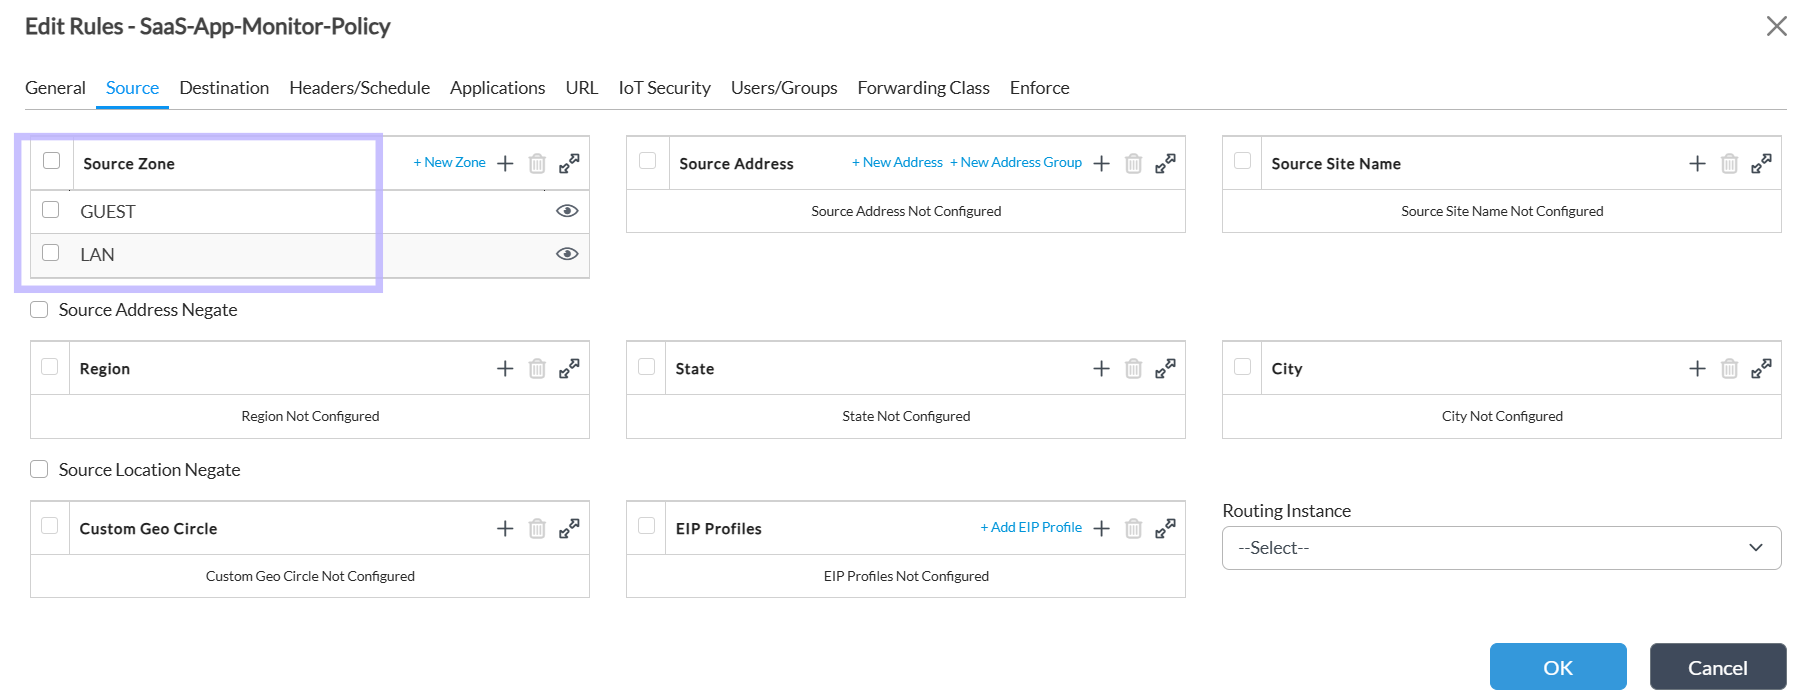
In source Match the Lan zone :-
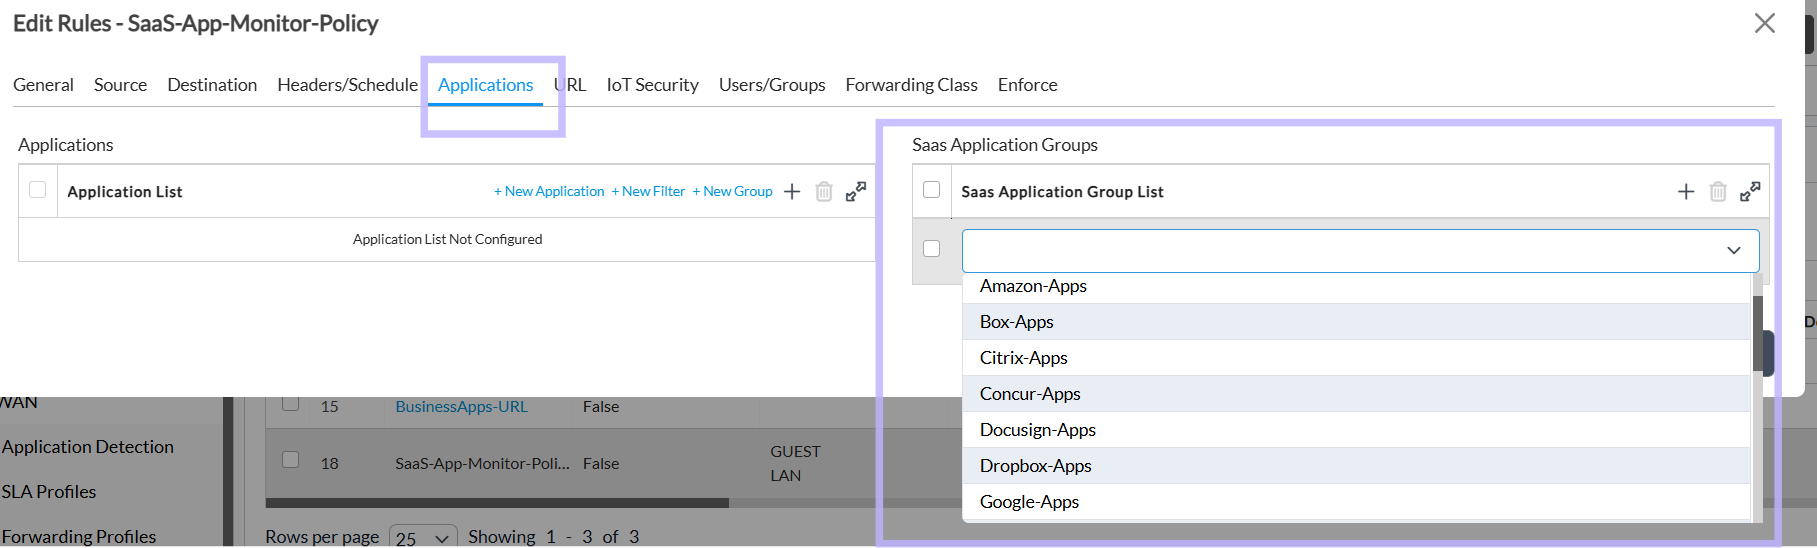
To match applications, go to the application tab then add applications from Saas Application group list or from application list.
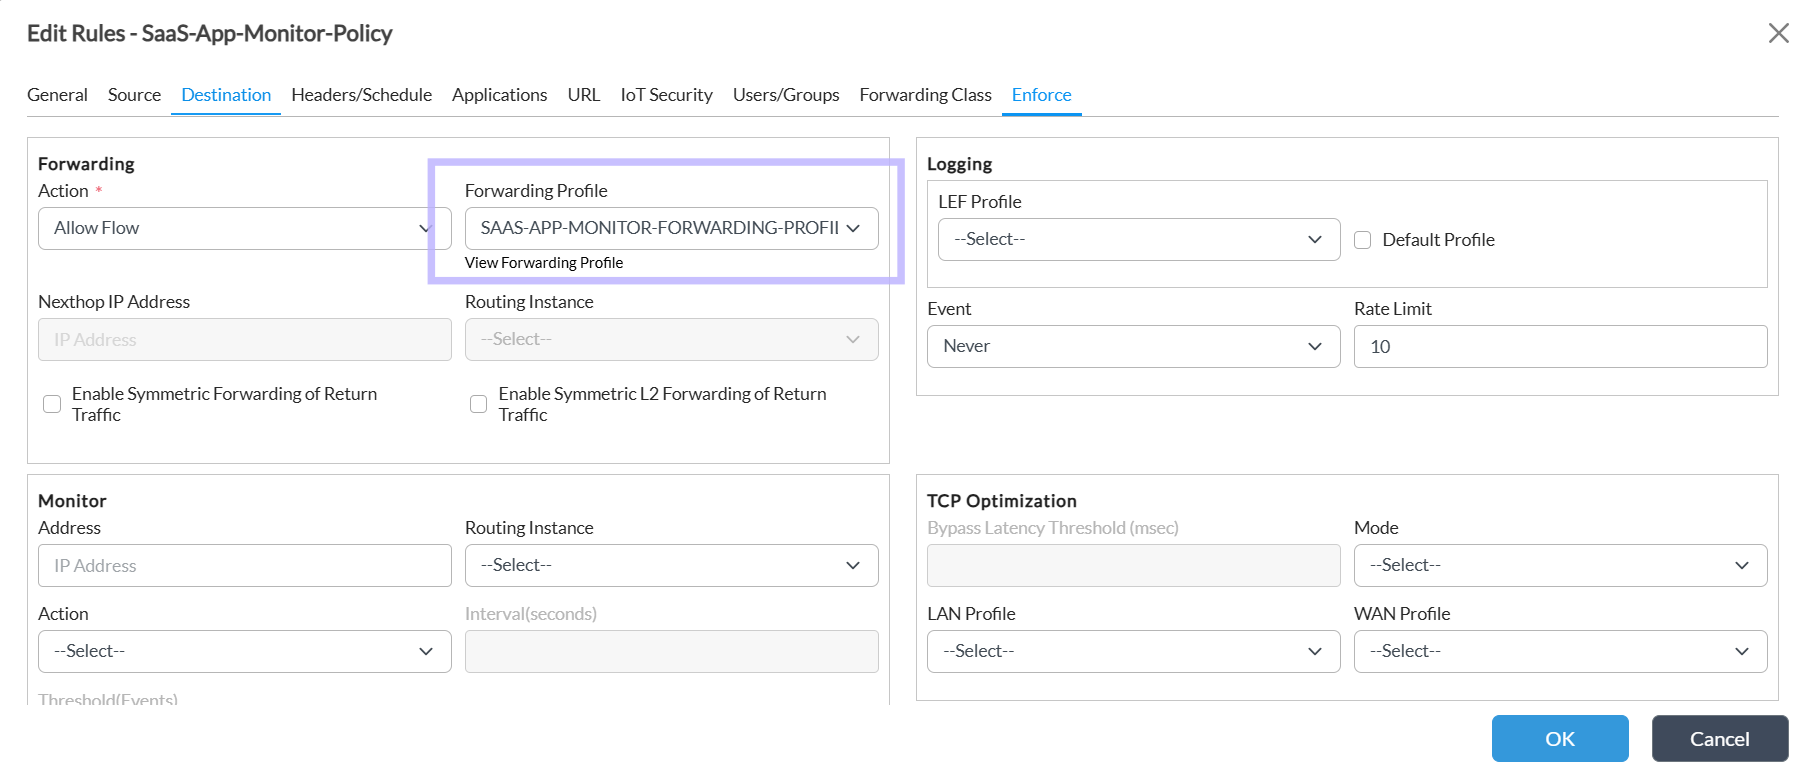
Go to the Enforce select Action - Allow flow and add the Forwarding Profile which was created on step 3.
To check SAAS monitor status go to the cli run the below commands:-
show application-monitor local detail
show orgs org-services <org name> sd-wan policies Default-Policy rules nexthop application-monitor detail <policy name>

Below shows that priority 1 BB transport NextHop is active.
if there is any sla volition in BB Transport then BB2 transport (priority 2) Nexthop will become active.
